When your VPS struggles, your visitors feel it first. Pages load slowly, forms stop working, or the site goes dark. Monitoring is how you find out about those problems before your customers do.
Monitoring a VPS means keeping a steady watch on the resources and services inside that server.
It’s watching how hard the processor is working, how much memory is free, whether the disk is filling up, and whether the services your site depends on are responding.
For your website, VPS monitoring is very critical. A server with maxed-out memory will freeze mid-request. A full disk stops your database from writing new entries.
And a crashed web service takes your homepage offline even though the server itself is still powered on. Monitoring gives you the warning signs early enough to act.
What Exactly Are You Monitoring?
| What to Monitor | Definition | Why Monitor |
| CPU Usage | The amount of processing power your VPS is using. | High usage can slow down your website or crash it. |
| RAM / Memory | The short-term memory your server uses to run apps. | If it runs out, your site may freeze or stop loading. |
| Disk Space | The storage space used for files, databases, and logs. | A full disk can stop your website from working. |
| Bandwidth | The amount of data transferred to and from your VPS. | Exceeding limits can cause extra fees or throttling. |
| Uptime / Downtime | Whether your server is online and reachable. | If your VPS is down, your website is down. |
| Network Speed | How fast data moves in and out of your server. | Slow speeds hurt user experience and SEO. |
| Running Processes | The programs and services active on your VPS. | Too many or stuck processes can waste resources. |
| Security / Logins | Failed logins, suspicious activity, and attacks. | Helps you catch hackers or breaches early. |
| Website Response Time | How long your site takes to load for visitors. | Slow loading drives visitors away. |
| Backups | Whether your data is being saved regularly. | Protects you if something breaks or gets deleted. |
How to Monitor Your VPS: 9 Essential Practices
1) Track Resource Usage
Watch CPU, RAM, disk, and bandwidth. These are the four resources your VPS has a fixed amount of, and when any one runs short, everything else suffers.
CPU usage shows how much processing power is being consumed. Watch for sustained high usage, not brief spikes. A short jump during a backup is normal.
A CPU that stays above 80% or 90% for several minutes means something is working too hard or stuck in a loop.
RAM is where your server keeps data it’s actively working with. When RAM runs out, the server uses swap space on the disk, which is much slower.
Your site freezes, pages time out, and services crash. Memory that climbs steadily over hours or days usually means a process is leaking and will eventually bring the server down.
Disk space holds your files, databases, logs, and temporary files. When it fills up, your database can’t write, your web server can’t serve cached files, and your site breaks.
Logs are a common culprit. They grow quietly until one day the disk is full.
Bandwidth measures how much data moves in and out of your server. Exceeding your plan’s limit can cause throttling or extra fees.
A sudden jump could mean a traffic spike, a misconfigured application, or someone using your server for something you didn’t intend.
Establish a baseline. Know what your server looks like on a normal day, and you’ll recognize when something changes.
2) Choose a Monitoring Tool
You need a tool that collects these numbers over time and shows them in one place. Checking manually works for troubleshooting but won’t tell you what happened at three in the morning.

Netdata installs in minutes, runs on your server, and gives you a real-time dashboard for CPU, memory, disk, network, and running services. It picks up common services automatically.
Zabbix and Nagios are heavier options built for larger environments with multiple servers. They take more setup and resources but give you more control over what you monitor and how you’re notified.
Prometheus paired with Grafana is the standard combination if you prefer building your own stack.
Prometheus collects and stores metrics; Grafana draws the graphs. It’s flexible but assumes comfort with configuration files.
The right tool is the one you’ll actually use. Start with something easy to set up. You can always add more later.
Then, centralize your metrics in one dashboard, so you’re not jumping between screens to understand what’s happening.
3) Set Up Alerts
Alerts turn monitoring from something you look at into something that tells you when to act.
Set thresholds for critical metrics. CPU above 85% for five minutes warrants a warning.
Disk above ninety percent is critical. Memory nearly full or swap being heavily used means trouble is close. Adjust these based on what you see on your server.
In addition, route alerts to email and your phone. Email for detail and records, SMS or push for things that need immediate attention. Some tools send alerts to Slack or other messaging platforms.
Keep the list short. If every fluctuation sends a notification, you’ll stop reading them, and you might miss out on a serious alert.
So, only alert on things you need to act on. Test your alerts after setting them up. An alert system you haven’t tested is one you can’t trust.
4) Monitor Uptime and Services
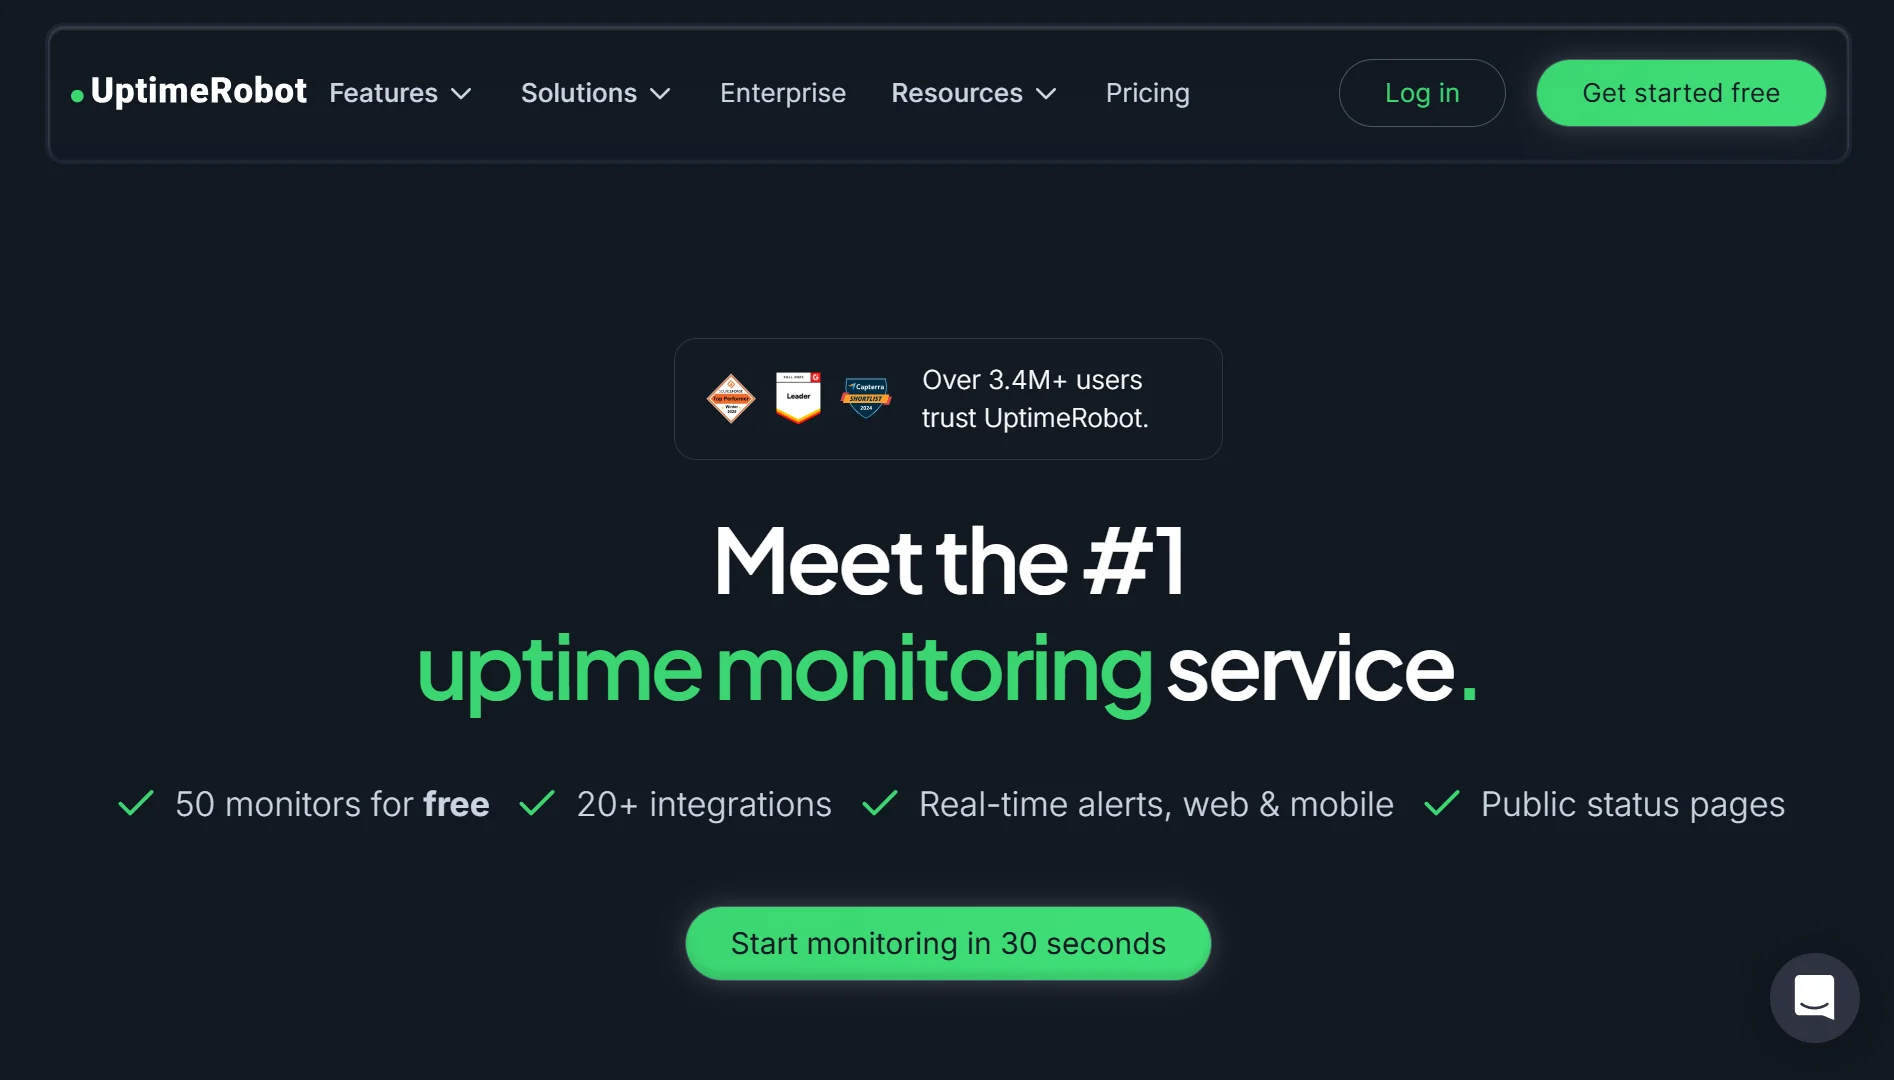
Resource graphs tell you what’s happening inside your server. They don’t tell you whether your website is reachable from the outside.
UptimeRobot and Better Stack ping your site from somewhere else on the internet at regular intervals.
If your site stops responding, they alert you. This catches network issues and firewall problems that internal monitoring misses.
But a ping can succeed while your web server is dead. Your server is reachable, but your site returns an error. So also monitor the services running on your VPS.
Check that your web server is running, your database is responding, and any other services your site depends on are working.
Most monitoring tools can verify a process is running and responding, and some can check specific URLs for the right status code.
External uptime checks plus internal service checks give you the complete picture.
5) Check Logs Regularly
Logs tell you why something went wrong, when it happened, and often what caused it.
Your web server’s error log shows why requests failed. The access log shows what traffic is hitting your site and from where.
System logs record authentication attempts, service starts and stops, and kernel warnings.
Look for patterns, not individual lines, because one error might be harmless. The same error repeating every few minutes is a problem. A sudden change in traffic volume or source could mean a bot or an attack.
Warnings that keep appearing point to something that needs fixing before it becomes critical.
Set up log rotation so your logs don’t fill the disk. If they’re growing faster than rotation can handle, that’s worth investigating.
6) Monitor Security
Security monitoring catches the early signs of an attack before it becomes serious.
Failed login attempts are the most common signal. A burst of failed SSH logins from the same address is someone trying to break in.
Track these and alert when the number crosses a threshold. Consider blocking repeat offenders or using a tool like Fail2ban.
Unusual outbound traffic is another warning sign. If your server suddenly sends large amounts of data to an address you don’t recognize, it could be compromised and used for spam, crypto mining, or attacking other systems.
Keep an eye on pending security updates. Every piece of software is a potential entry point, and updates fix known vulnerabilities.
Enable automatic updates where you can and check regularly for anything manual.
File integrity monitoring watches for changes to critical system files and alerts you if something is modified unexpectedly.
Most breaches involve some level of tampering, and catching it early saves trouble.
7) Test Website Speed

Your server’s internal metrics can look fine while your website feels slow to visitors. Use GTmetrix or PageSpeed Insights to measure how long a real browser takes to load your pages.
These tools break down what’s slow, from server response time to image sizes to JavaScript execution, and give you specific recommendations.
Test from different locations if your audience is spread out. A site that loads quickly in one region might be slow in another.
Run these tests regularly; performance drifts as you add content, install plugins, or change your setup. Slow response times hurt search rankings and push visitors away.
If the numbers get worse after a change, you’ll know before your customers complain.
Google’s Core Web Vitals are a good benchmark to follow since they reflect what Google considers important for user experience.
8) Verify Your Backup
A backup you haven’t tested is a guess. You don’t know if it will restore correctly until you try.
Schedule regular backups and store them somewhere separate from your server. A backup on the same disk as your data doesn’t help if the disk fails.
To test, pick a file or a database table, restore it, and confirm it opens correctly. Do this on a schedule, not just once. A backup process that runs without errors can still produce unusable files.
Also, monitor your backup status. Check that the job ran, the file exists, and it’s recent enough to be useful.
If your backup process fails silently, you’ll only find out when you need it most. Most backup tools can notify you when a job completes or fails. Set that up and pay attention.
9) Review Performance Reports
Once a week or once a month, look at the long-term trends. Day-to-day monitoring catches immediate problems, but slow changes only become visible over time.
Is memory usage higher this month than last? Has disk space been shrinking steadily? Are response times creeping up?
These slow changes tell you when to upgrade your plan, clean up old files, or investigate a process that’s been quietly growing.
Look at the graphs over a longer period and compare them to previous months. If you don’t have historical data yet, start keeping notes.
A simple record of what your server looked like last month gives you something to compare against.
A weekly review catches problems that alerts alone won’t flag because nothing crossed a threshold yet. You’ll see a disk filling at a steady rate and know it’s time to clean up.
You’ll notice CPU usage has been higher since you installed a new plugin. You’ll spot the pattern before it becomes an outage.
Ready to Monitor Less and Grow More?
Running a VPS doesn’t have to mean babysitting graphs all day.
At Truehost, we give you the server and the room to grow, so your monitoring setup watches the numbers while you focus on your work.
Our Cloud VPS plans start small and scale with you. Cloud VPS Elite gives you a dedicated starting point at USh 16,257.56, with one core, a gigabyte of RAM, and twenty-five gigabytes of SSD storage. Cloud VPS 1 doubles the memory to two gigabytes at USh 22,906.63, which suits a growing site or a small application.
When you need more headroom, Cloud VPS 2 brings two cores and four gigabytes of RAM at USh 41,785.23, while Cloud VPS 3 steps up to four cores and eight gigabytes at USh 83,816.83.
Every plan runs on KVM virtualization with full root access, so you can install whatever monitoring tool you prefer and configure it exactly how you want.
And when something does need attention, our support team is here to help you sort it out.
You don’t need to watch everything yourself. Set up the checks, let the alerts do their job, and get back to what you’re building.
